Analytics Dashboards
Analytics dashboards that turn product metrics into decisions.
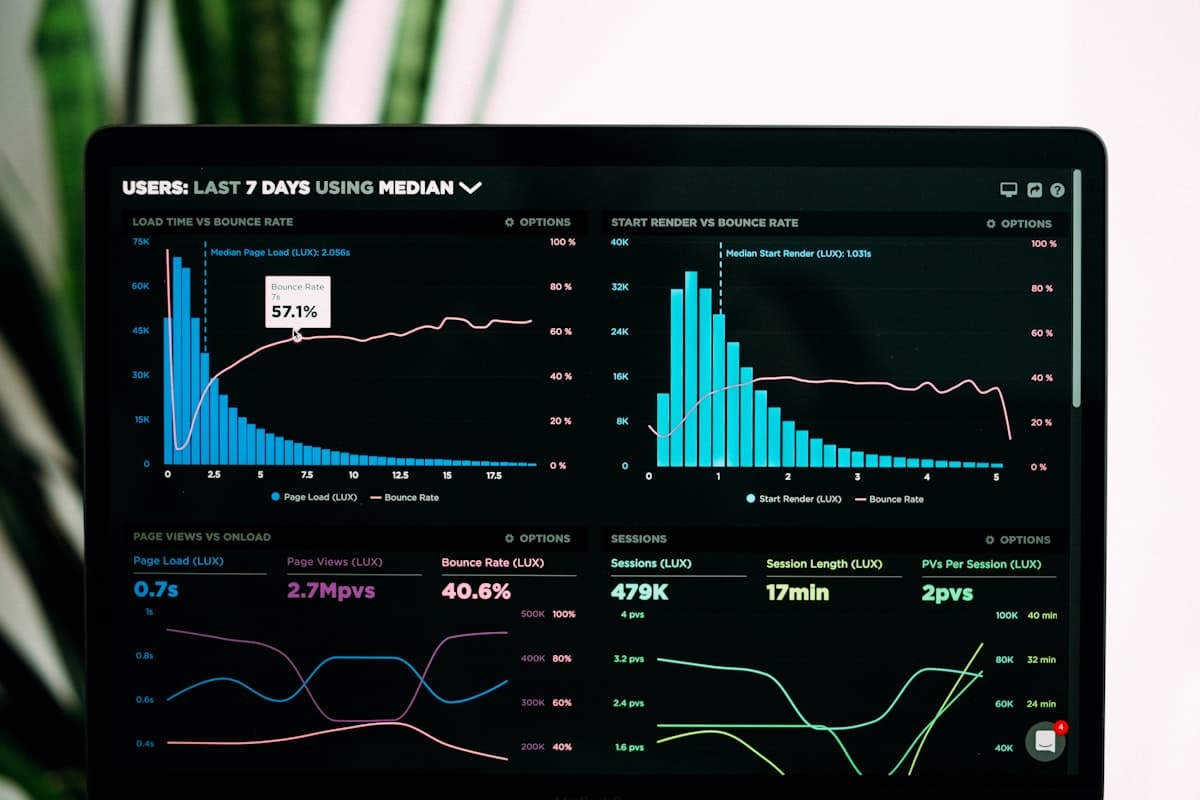
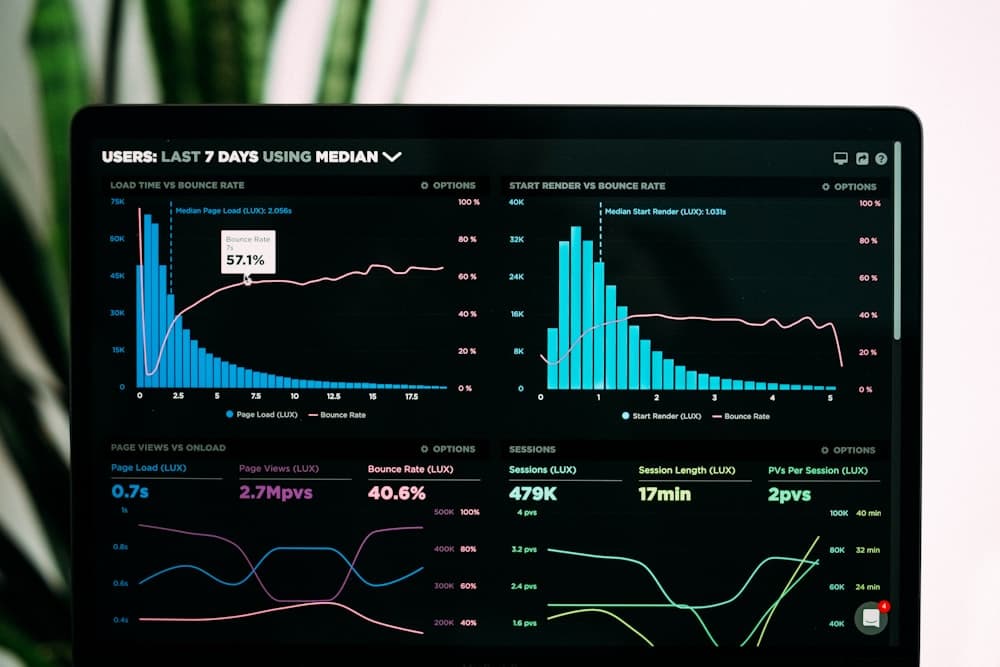
Leeonex builds analytics dashboards so teams can see funnels, usage, and KPIs without weekly spreadsheet exports. Metrics are defined clearly and presented in decision-ready views for growth, retention, and customer success work.
Get expert help for your project
Share a short brief for analytics dashboards. Leeonex replies with next steps — not a hard sell.
At a glance
- What it is
- Leeonex analytics dashboard development defines KPIs and builds filterable views on top of data you already have.
- Who it is for
- For product, growth, and leadership teams who need living metrics instead of static exports.
- What Leeonex delivers
- Metric definition workshop, data model and queries, charts and summaries, filters and saved views, and role-based access.
- How it starts
- List the decisions you make weekly and where the data lives — then scope a first board around those questions.
Best analytics dashboards
What Leeonex covers in analytics dashboards.
Specialty depth — not a generic agency pitch. Each item is part of how this engagement is scoped and delivered.
Metric definition
Agree what KPIs mean before charts pretend to answer them.
Data model and queries
Reliable definitions so numbers do not disagree across views.
Charts and summaries
Visuals that highlight trends and exceptions — not chart junk.
Filters and saved views
Let teams slice data without exporting to spreadsheets every Monday.
Role-based access
Show the right metrics to the right people.
Why this offering fits
Why teams choose Leeonex for analytics dashboards
Leeonex defines the decision before the chart. Dashboards stay filterable and role-aware so teams stop living in weekly spreadsheet exports.
- Metrics are defined with stakeholders before pixels are drawn.
- Dashboards exist to support decisions — not to look busy.
- Access and definitions stay consistent so trust in the numbers holds.
Capabilities
Capabilities for analytics dashboards.
Practical strengths this specialty brings to your project — scoped to how Leeonex actually delivers.
Product analytics
Usage and funnel views tied to decisions you actually make.
Executive summaries
High-level boards that stay honest about what is known.
Customer success metrics
Health signals that help teams intervene earlier.
Consistent definitions
Shared metric language across product, growth, and leadership.
Export when needed
Downloads for stakeholders who still need offline artifacts.
Performance at scale
Queries and caching that keep boards usable as data grows.
What Leeonex delivers
What is actually included in the work.
Scope is agreed before development starts, so you know what the first version covers and what is deliberately left for later.
- 01Metric definition workshop
- 02Data model and queries
- 03Charts and summaries
- 04Filters and saved views
- 05Role-based access
When this fits
Situations where this service is the right solution.
- 01
When product analytics live in ad-hoc queries instead of a shared board.
- 02
When growth and funnel views need a reliable home.
- 03
When executives need a clear summary without a BI rabbit hole.
- 04
When customer success metrics should be visible to the right roles.
How we work
From idea to launch — without the fog.
Four clear stages. You always know the goal, the scope, and what ships next.
- Step 01
Understand
We clarify your goals, audience, workflows, and business priorities.
Goals & context
- Step 02
Plan
We define the right scope, features, pages, integrations, and technical approach.
Scope & approach
- Step 03
Design & Build
We create clean interfaces and reliable systems with practical engineering decisions.
Working product
- Step 04
Review & Improve
We test, refine, and prepare the product for launch or the next development phase.
Launch-ready build
Scope first. Clear timelines. Direct founder ownership from the first conversation.
Book a consultationRelated specialties
Other offerings in this category.
Related services
Often planned alongside this.
Explore adjacent capabilities when the brief spans more than one delivery track.
AI Automations & AI-Powered Features
Practical AI workflows, internal automations, and product features built around real processes — with human review where decisions matter.
- SMBs
- Founders
- Ops teams
Full-Stack Web Applications
Custom web platforms, portals, admin panels, and business systems with reliable frontend, backend, and data structure.
- Startups
- Businesses
- Enterprise teams
FAQ
Questions about this service.
It answers decisions people actually make — funnels, retention, revenue, or usage — with trusted definitions. Charts without decisions are decoration.
Yes. Metric workshops clarify formulas and ownership so two teams are not arguing over different numbers that look similar.
Yes. Filters, date ranges, and saved views are standard when different roles need different slices of the same data.
Yes, with role-aware views. Executives often need summaries; operators need drill-downs. Both can live in one product without forcing one layout.
From your existing databases, warehouses, or product events. Leeonex maps sources before promising visuals.
Refresh cadence is designed to match the decision — real-time, hourly, or daily. The UI should state freshness so nobody mistakes stale data for live truth.
Yes. Analytics dashboards can be standalone or embedded. Embedding needs auth and performance design up front.
Ready to talk about analytics dashboards?
Share the KPIs that matter and who uses them. Leeonex will help define metrics and a first dashboard you can operate daily.
No fake promises. Just clear product and engineering discussion.