Data Visualization
Data visualization that makes complex information scannable and honest.
Leeonex designs data visualization for executives, researchers, and product teams who need scannable charts without misleading decoration. Trends, outliers, and comparisons stay clear so stakeholders can communicate findings with confidence.
Get expert help for your project
Share a short brief for data visualization. Leeonex replies with next steps — not a hard sell.
At a glance
- What it is
- Leeonex data visualization selects charts, filters, and drill-downs that answer real questions without distorting the data.
- Who it is for
- For executives, researchers, and product teams who present or explore complex datasets.
- What Leeonex delivers
- Chart selection for the question, interactive filters, drill-down patterns, a consistent visual system, and responsive layouts.
- How it starts
- Start from the question the audience must answer — then choose the visual form that serves it.
Best data visualization
What Leeonex covers in data visualization.
Specialty depth — not a generic agency pitch. Each item is part of how this engagement is scoped and delivered.

Chart selection
Pick visuals that match the question — comparison, trend, or distribution.
Interactive filters
Explore without losing the story or inventing misleading defaults.
Drill-down patterns
Move from summary to detail without trapping users in dead ends.
Visual system
Consistent color, typography, and spacing across charts.
Responsive layouts
Readable on desktop and tablet without crushing labels.
Why this offering fits
Why teams choose Leeonex for data visualization
Leeonex chooses visuals that answer the question without distorting the data. Executives and researchers get scannable charts they can trust in conversation.
- Chart choice follows the question — not the prettiest template.
- We keep scales and labels honest so trust stays intact.
- Visuals are built to embed and maintain, not just screenshot once.
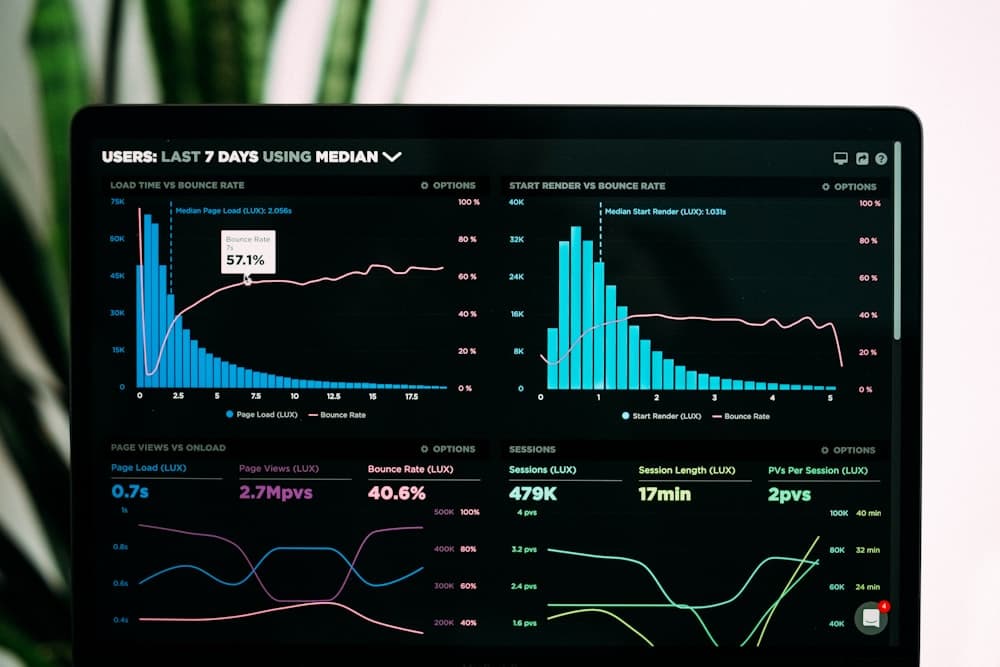
Capabilities
Capabilities for data visualization.
Practical strengths this specialty brings to your project — scoped to how Leeonex actually delivers.
Executive storytelling
Boards that make complex data scannable in a short meeting.
Embedded product charts
Visualizations that live inside your app — not only BI tools.
Honest scales
Axes and baselines that do not exaggerate for drama.
Research and survey views
Results presented without burying the signal in decoration.
Financial trend layouts
Clear patterns for money and volume over time.
Accessibility in viz
Contrast, labels, and alternatives so charts are not color-only.
What Leeonex delivers
What is actually included in the work.
Scope is agreed before development starts, so you know what the first version covers and what is deliberately left for later.
- 01Chart selection for the question
- 02Interactive filters
- 03Drill-down patterns
- 04Consistent visual system
- 05Responsive layouts for desktop and tablet
When this fits
Situations where this service is the right solution.
- 01
When executive storytelling boards must stay clear and honest.
- 02
When research or survey results need scannable presentation.
- 03
When financial trends should be comparable without chart junk.
- 04
When embedded product charts must match the rest of the UI system.
How we work
From idea to launch — without the fog.
Four clear stages. You always know the goal, the scope, and what ships next.
- Step 01
Understand
We clarify your goals, audience, workflows, and business priorities.
Goals & context
- Step 02
Plan
We define the right scope, features, pages, integrations, and technical approach.
Scope & approach
- Step 03
Design & Build
We create clean interfaces and reliable systems with practical engineering decisions.
Working product
- Step 04
Review & Improve
We test, refine, and prepare the product for launch or the next development phase.
Launch-ready build
Scope first. Clear timelines. Direct founder ownership from the first conversation.
Book a consultationRelated specialties
Other offerings in this category.
Related services
Often planned alongside this.
Explore adjacent capabilities when the brief spans more than one delivery track.
AI Automations & AI-Powered Features
Practical AI workflows, internal automations, and product features built around real processes — with human review where decisions matter.
- SMBs
- Founders
- Ops teams
Full-Stack Web Applications
Custom web platforms, portals, admin panels, and business systems with reliable frontend, backend, and data structure.
- Startups
- Businesses
- Enterprise teams
FAQ
Questions about this service.
Choosing chart types that match the question, building interactive filters and drill-downs, and shipping a consistent visual system that stays readable on desktop and tablet.
Yes. Embedded product charts are a common deliverable. Performance and empty states are treated as product UX, not BI afterthoughts.
By using honest scales, clear units, and chart types suited to the comparison. Decorative chart junk is avoided.
Yes. Survey and research results can be turned into scannable visual summaries for stakeholders.
Choices follow the product stack and interaction needs. The library is a means; clarity of the visual answer is the goal.
Interactive filters and guided drill-downs help. For audiences who will not explore, static narrative visuals may be better.
Empty and partial states are designed explicitly so missing data is not mistaken for zero.
Ready to talk about data visualization?
Share the dataset and the question stakeholders ask. Leeonex will help design visualization that stays readable and trustworthy.
No fake promises. Just clear product and engineering discussion.