The short answer: budget a user outcome under stated load
Useful web application performance requirements name a critical user journey, the population and conditions being measured, a target and percentile, the expected workload and dataset, the evidence source, and the action owner when the target is missed. They connect browser experience to APIs, data, dependencies, background work, and operational capacity.
“Pages should load quickly” and “the system should scale” cannot guide architecture or acceptance. Start with two or three costly journeys: finding a record, saving a transaction, completing an approval, importing a file, or producing a report. Describe what the user considers complete, then measure the full path.
Outcome
One critical journey
Condition
Population, data, and load
Evidence
Percentile, source, and owner
Choose a business journey before choosing a metric
Write the journey from a user's trigger to a useful visible result. “Search” might mean opening a screen, entering filters, receiving accurate results, and being able to open a record. “Import” may continue after the upload request and only finish when validation, processing, reconciliation, and error reporting are complete. Those paths need different indicators.
| Journey type | User-visible indicator | Supporting evidence |
|---|---|---|
| Initial view | Useful content is visible and stable | LCP, INP, CLS, resources, server timing |
| Interactive task | Action produces the correct visible state | Custom user timing, API latency, errors, traces |
| Background job | Result is ready within the promised window | Queue delay, processing time, retries, failures |
| Bulk workflow | Required volume completes without data loss | Throughput, tail latency, saturation, reconciliation |
Use existing analytics, support incidents, interviews, traces, and operational deadlines to rank journeys. If evidence is thin, instrument one path before promising a hard target. This follows the same observable-outcome principle used in a software acceptance criteria checklist: specify what can be seen and decided, not an adjective.
Cover six performance requirement lanes
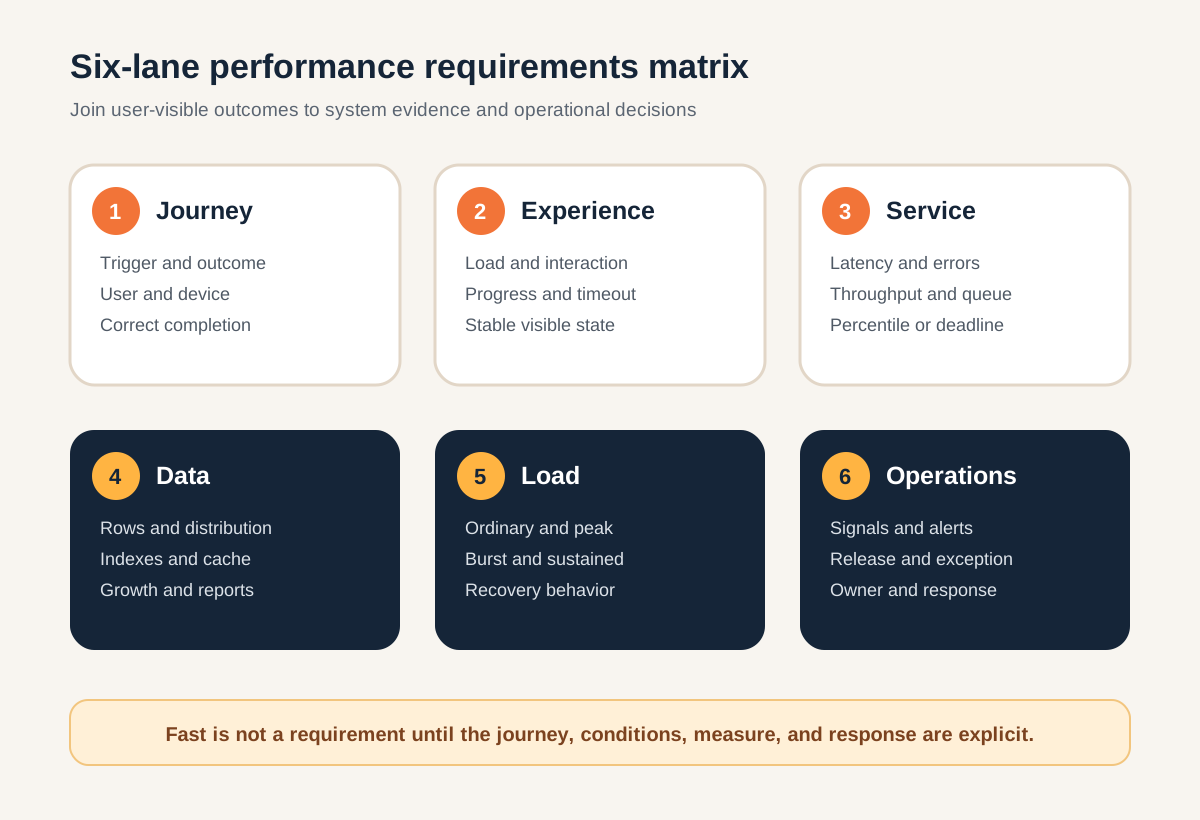
- Journey: trigger, steps, completion state, correctness, user group, device, and network assumptions.
- Experience: loading, interaction, visual stability, progress, cancellation, timeout, and the experience of partial or stale data.
- Service: endpoint or job latency, error rate, throughput, concurrency, payload, and the percentile or deadline that matters.
- Data: realistic row counts, filters, indexes, tenant distribution, growth, cache state, and expensive report or export shapes.
- Load: ordinary, peak, burst, sustained, recovery, and background workloads with an explicit traffic model.
- Operations: field measurement, traces, alerts, ownership, release gates, capacity review, and the response to a consumed budget.
Avoid inventing a universal response-time number. The target for an interactive approval is different from a large export, and an internal tool with a controlled network is different from a public application used on low-end phones. Requirements should make those tradeoffs visible.
Allocate an end-to-end budget without hiding the tail
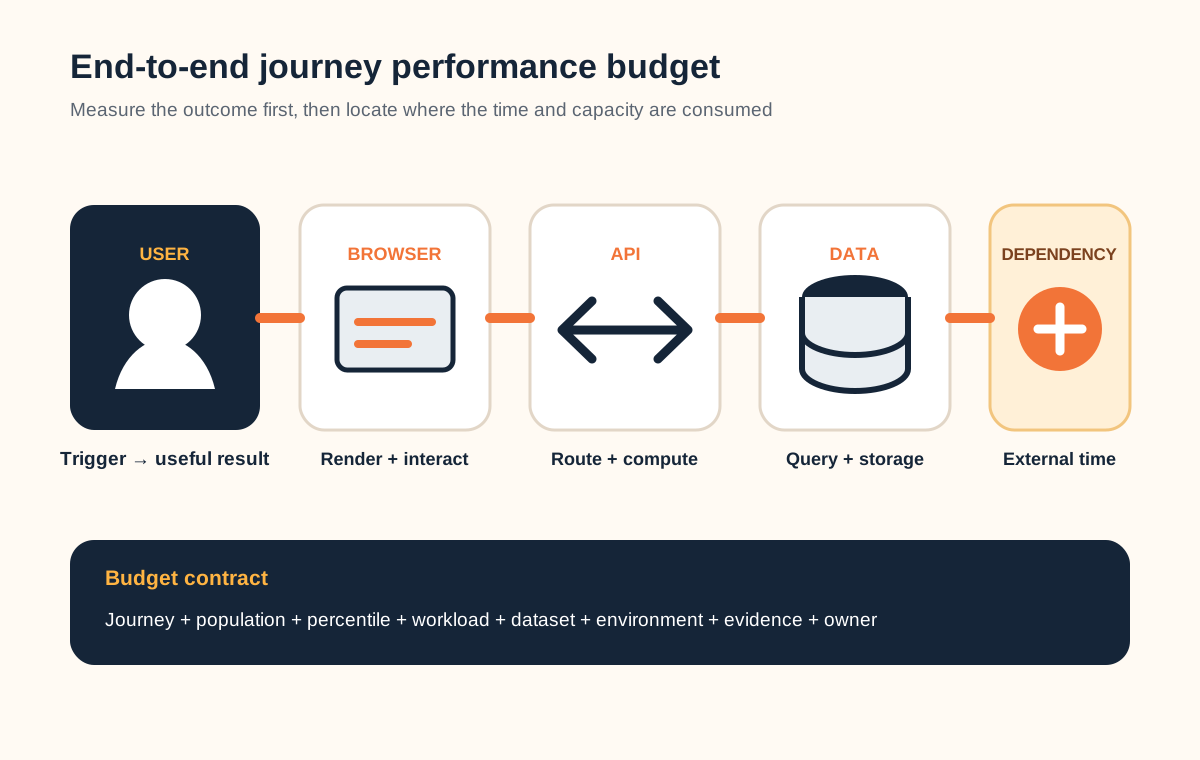
For public or broadly distributed browser experiences, Core Web Vitals provide useful field thresholds. Google's current Core Web Vitals methodology defines “good” at the 75th percentile as LCP at or below 2.5 seconds, INP at or below 200 milliseconds, and CLS at or below 0.1. Treat these as relevant browser experience indicators, not proof that an authenticated workflow or background task is fast.
Measure custom product work at meaningful boundaries. The User Timing API lets a browser add named marks and measures for important application tasks. Combine this with server and dependency timing so the team can distinguish rendering, network, application, query, queue, and third-party time.
Prefer a percentile over an average when slow outliers matter. Google's SRE guidance on service-level objectives explains that averages can hide tail latency and recommends a small set of indicators tied to what users care about. A complete requirement might state: “For successful searches by active customers, the 95th percentile from submit to usable results will meet the agreed target under the peak workload and reference dataset, measured in the browser and production-like test environment.” The actual target must come from your evidence.
Test realistic load, saturation, and recovery
A concurrency number without behavior is not a workload. Describe the mix of reads, writes, searches, uploads, exports, scheduled jobs, retries, and tenant sizes. State how quickly traffic ramps, how long the test runs, which cache state applies, and what data volume exists. Keep correctness checks active: a fast response is not acceptable if it is stale, incomplete, duplicated, or lost.
Include the boundaries that can dominate the path: database connections, queues, object storage, email or payment services, identity providers, rate limits, and regional network paths. Define graceful behavior for a slow dependency, a timeout, a partial response, exhausted capacity, and recovery after the load drops. Decide whether work queues, sheds, degrades, retries, or stops—and what the user sees.
Run the smallest test that answers the current risk. A new report may need a production-like dataset and query profile, while a seasonal peak may need sustained mixed traffic plus recovery. Do not run uncontrolled tests against production or customer data; obtain operational approval, protect personal data, and define stop conditions.
Join release evidence to production measurement
Lab tests are reproducible; field data represents real devices, networks, accounts, data shapes, and dependencies. Use both. Instrument the chosen journeys with enough context to segment by route or operation, version, region, device class, tenant size, or other non-sensitive factors that change the decision. Avoid user identifiers and high-cardinality labels that create privacy or operational problems.
OpenTelemetry describes traces, metrics, and logs as signals that expose system activity. Its signals documentation is a useful reference for planning correlation across services. Your requirement should still name which signal answers which question: traces locate consumed time, metrics show distributions and saturation, and logs explain selected events and failures.
Set ownership and action rules. A breached release budget may block a change, require an approved exception, or trigger a focused test. A production SLO breach may pause feature work, open an incident, or start a capacity review. Connect these rules to the ongoing web application maintenance checklist so performance does not disappear after launch.
Use one acceptance brief per critical journey
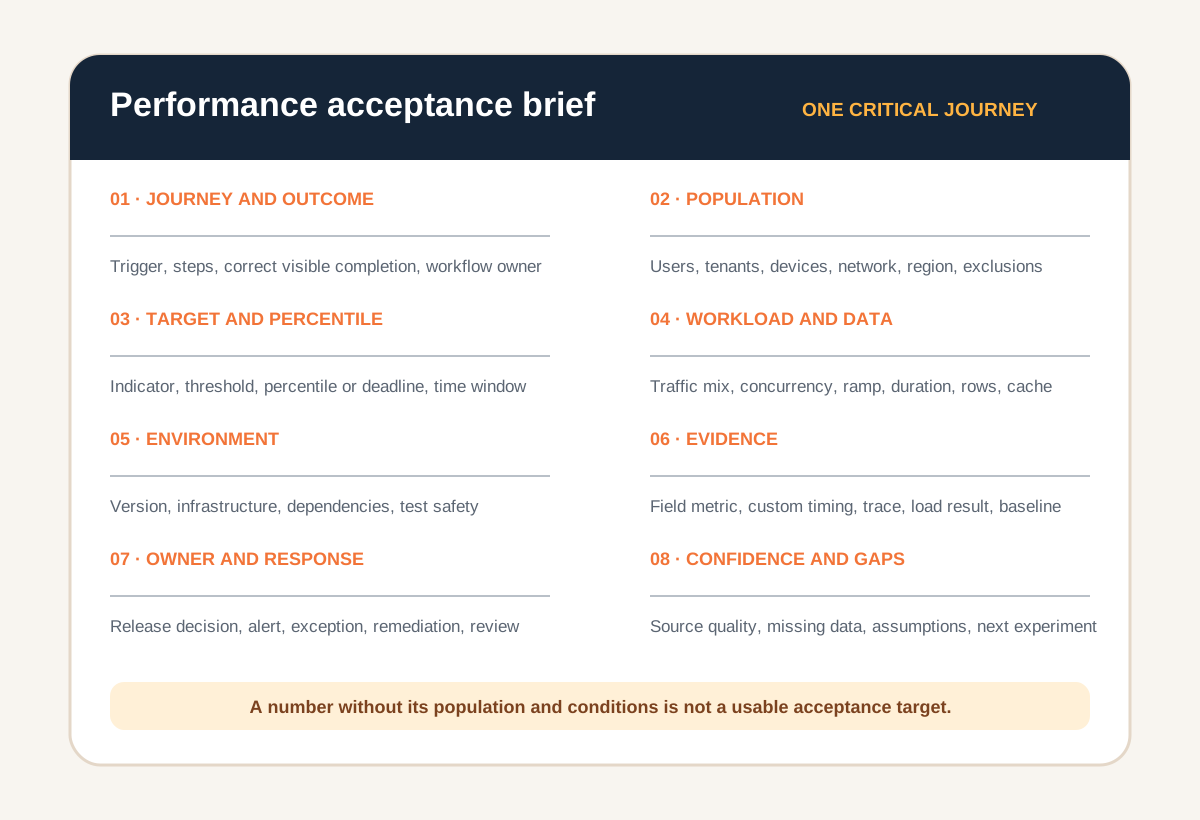
Complete the brief with product, engineering, operations, and a representative user or workflow owner. Record the journey, population, target, percentile, workload, dataset, environment, dependencies, evidence source, exclusions, owner, and response. Add the current baseline and confidence level when available.
Profile before choosing a large rewrite. One slow query, an oversized payload, serial dependency calls, or missing progress feedback may justify a focused repair. Modernization becomes more plausible when the same structural constraint affects several critical journeys or safe measurement and release are impossible. The refactor-or-rewrite decision guide can help separate recovery scope from replacement scope.
Leeonex's web application development service can help define and implement a measurable first improvement, whether the need is a new workflow, instrumentation, a focused performance repair, or a maintainable application boundary.
Frequently asked questions
What are web application performance requirements?
Web application performance requirements are measurable expectations for critical user journeys and system work under stated conditions. They define what is measured, the target and percentile, user or request population, workload, dataset, device and network assumptions, environment, evidence source, and release or operational response when the target is missed.
Should every web application use Core Web Vitals as its performance target?
Core Web Vitals are useful field measures for loading, responsiveness, and visual stability in browser experiences, but they do not cover authenticated workflow completion, API latency, background jobs, imports, reports, third-party dependencies, or capacity. Use them where they match the experience and add journey-specific indicators elsewhere.
Should performance requirements use averages or percentiles?
Percentiles usually reveal the slower part of the experience more clearly than an average, which can hide a long tail. State the percentile and population explicitly, such as the 95th percentile for successful invoice searches under an agreed workload, rather than saying the average page should be fast.
What is the difference between a performance budget and an SLO?
A performance budget is a design or release constraint, such as a browser resource limit or a maximum duration for part of a journey. A service-level objective is an operational target for a measured service indicator over a time window. A product may use both: budgets prevent regressions before release, while SLOs govern real production behavior.
When does a slow web application need modernization instead of tuning?
Modernization becomes more likely when profiling shows the same architectural constraint across multiple critical journeys, safe measurement is missing, dependencies cannot scale, data access requires structural change, or every improvement is blocked by brittle deployment and test paths. Isolated regressions or one expensive query usually justify a smaller repair first.