Answer first
The smallest useful dashboard is a decision loop, not a wall of KPIs.
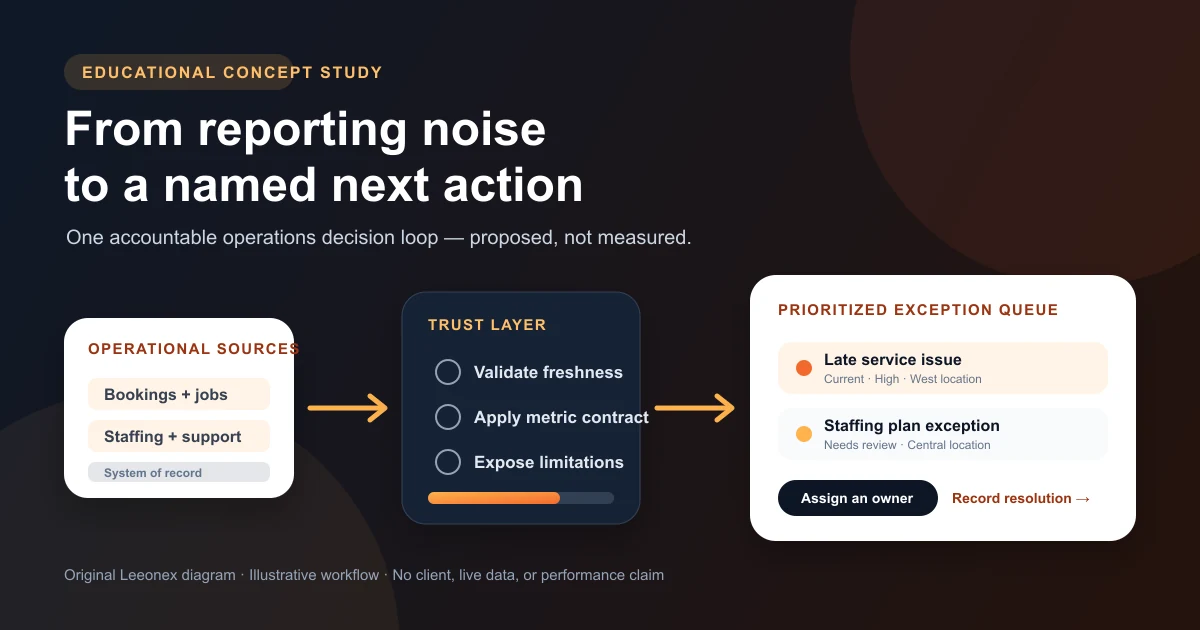
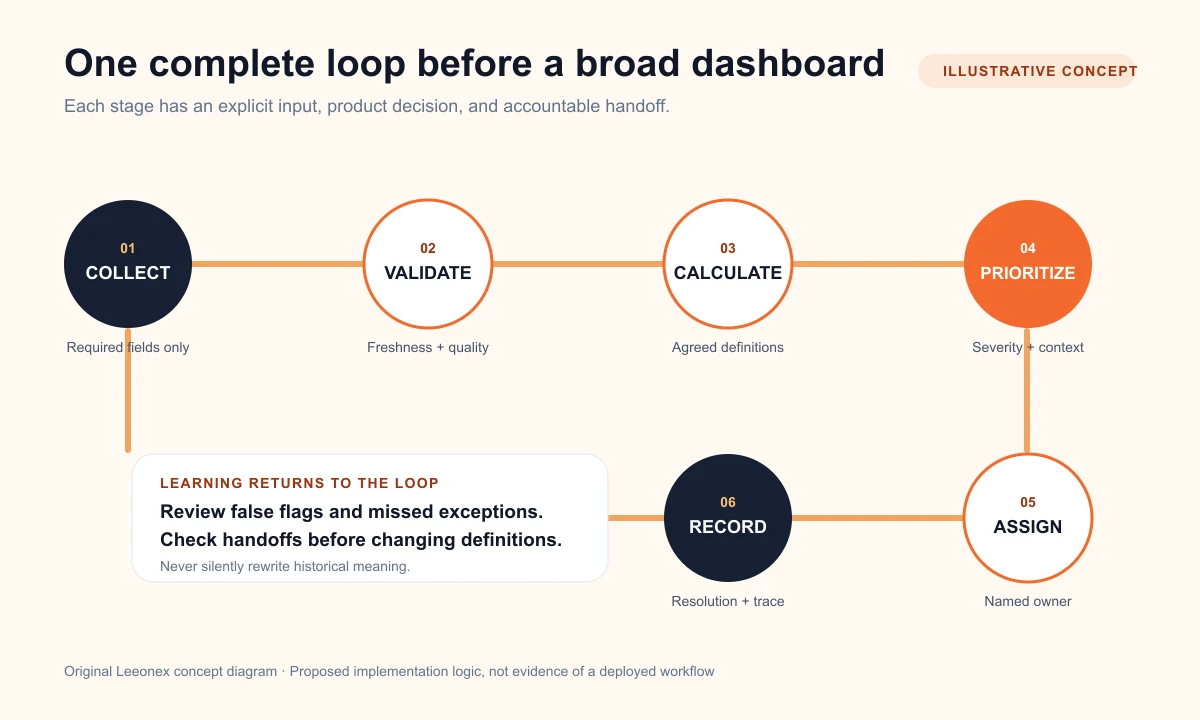
For an operations team managing several locations, version one should surface a bounded set of exceptions, show whether the data is current, explain why each item was flagged, assign a person, and record the resolution. That is enough to test whether the reporting product supports a real operating cadence.
A broad executive dashboard can come later. Starting with every KPI, source, and stakeholder usually expands integration and definition work before the team has proved one complete path from signal to action.
Illustrative discovery conversation — not a client quotation
“Show us everything” becomes useful only after the next decision is named.
Operations lead
“We have weekly spreadsheets for every location. Can we put all the numbers on one live dashboard?”
Leeonex
“When the review starts, which exceptions change what your team does that day?”
Operations lead
“Late jobs, unresolved complaints, and locations missing their staffing plan need an owner quickly.”
Leeonex
“Then the first product should make those exceptions current, explainable, assignable, and traceable before it becomes a company-wide analytics library.”
This exchange is Leeonex-authored teaching material. It represents no customer, quotation, engagement, or deployed system.
Intended buyer and constraint
This concept is for operators who can see the numbers but still cannot see the queue.
The buyer is an operations leader, multi-location owner, or product team with recurring reports across branches, sites, or service lines. Data may live in booking, staffing, CRM, finance, or support tools plus manual spreadsheets. The immediate problem is not visual polish; it is finding which exceptions deserve attention and who owns the follow-up.
The main constraints are definition disagreements, delayed or partial source access, different location permissions, manual corrections, and refresh timing. The concept assumes those constraints are made visible instead of being hidden behind a green status card.
Operations lead
Sets thresholds, reviews the cross-location queue, reassigns priorities, and sees whether exceptions were resolved.
Location manager
Sees only relevant exceptions, adds context, accepts or redirects ownership, and records the action taken.
Data owner
Owns definitions, source access, refresh health, reconciliation, and the visible limitations attached to each signal.
Smallest useful scope
Build one exception queue with enough context to resolve it.
Choose one operating cadence and a coherent exception family—for example late jobs and unresolved service issues reviewed each morning. Give each signal a metric contract, threshold, source, freshness expectation, severity, location, and owner. Add a detail view with the source context needed to investigate, then capture assignment, notes, status, and resolution.
Version one can use a scheduled refresh if that matches the decision. It needs authentication, role and location access, source validation, a visible stale state, an exception queue, filtering, ownership, and an audit history. It does not need a custom chart library or real-time infrastructure by default.
Architecture choices
Separate source truth, reporting logic, and workflow state.
Source applications remain systems of record. A scheduled integration copies only required fields into a reporting model, validates freshness and quality rules, and calculates agreed signals. The web application reads that model and stores workflow state—assignment, notes, acknowledgements, and resolutions—in its own audit trail.
That separation avoids writing operational follow-up into a source that was never designed for it, while keeping every signal traceable to its definition and origin. If source access is too fragile or definitions remain disputed, integration or metric work should precede the dashboard. The existing Leeonex dashboard data readiness checklist is the companion pre-build audit for that decision.
Risks and guardrails
A wrong or stale exception can waste attention, so trust states are product features.
- Show the last successful refresh and a stale-data state beside every time-sensitive signal.
- Keep metric definitions, thresholds, and source ownership visible to the people expected to act.
- Limit access by role and location; a reporting need does not justify exposing every record.
- Record assignment, context, status changes, and resolution instead of treating a viewed chart as an outcome.
Build now, validate, or leave out
Delay breadth until the first queue earns it.
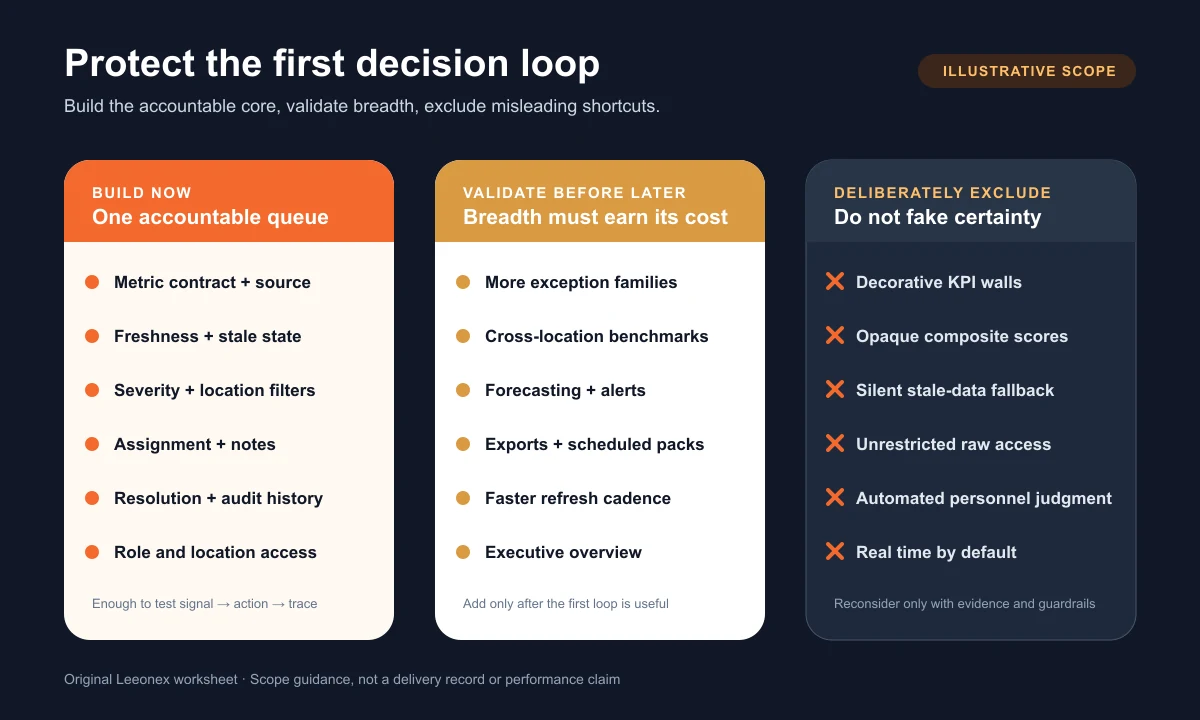
Build the definition, source check, exception queue, detail, ownership, resolution, and audit history now. Validate additional exception families, cross-location benchmarks, forecasting, alerts, exports, and faster refresh against actual decisions and operating cost before adding them.
Deliberately exclude decorative KPI walls, opaque composite scores, unrestricted raw-record access, automated personnel judgments, and silent fallbacks to old data. These exclusions are not missing polish; they protect the product from looking more certain than its evidence.
Limitations and evidence boundary
This concept proves no dashboard performance or business outcome.
No system was built or launched for this study. No customer, adoption, data accuracy, time saving, error reduction, decision improvement, revenue, or operational result is claimed. The workflow, roles, signals, and architecture are proposed scope decisions only.
Stronger claims would require an implemented system, approved identity or anonymization, source and reconciliation records, defined baselines, real user roles, launch and adoption windows, metric calculations, exclusions, attribution limits, a verifier, approved visuals, and publication permission.
Lessons and first consultation
Bring the operating review, not a dashboard wishlist.
The central lesson is simple: reporting becomes a product when a user can trust a signal, decide, act, and leave a trace. These inputs make a first conversation concrete:
- One recurring review where the team currently spends time finding what needs attention
- The report, spreadsheet, or source screens used today, including disputed examples
- The people who decide, investigate, act, and resolve data-definition questions
- Required refresh timing, sensitive fields, access constraints, and the cost of a wrong signal
Explore Leeonex operations reporting development for the closest service path, or return to the case-study hub to compare other evidence types and product decisions.
Have one recurring operations review?