The short answer: your data can be imperfect, but it cannot be mysterious
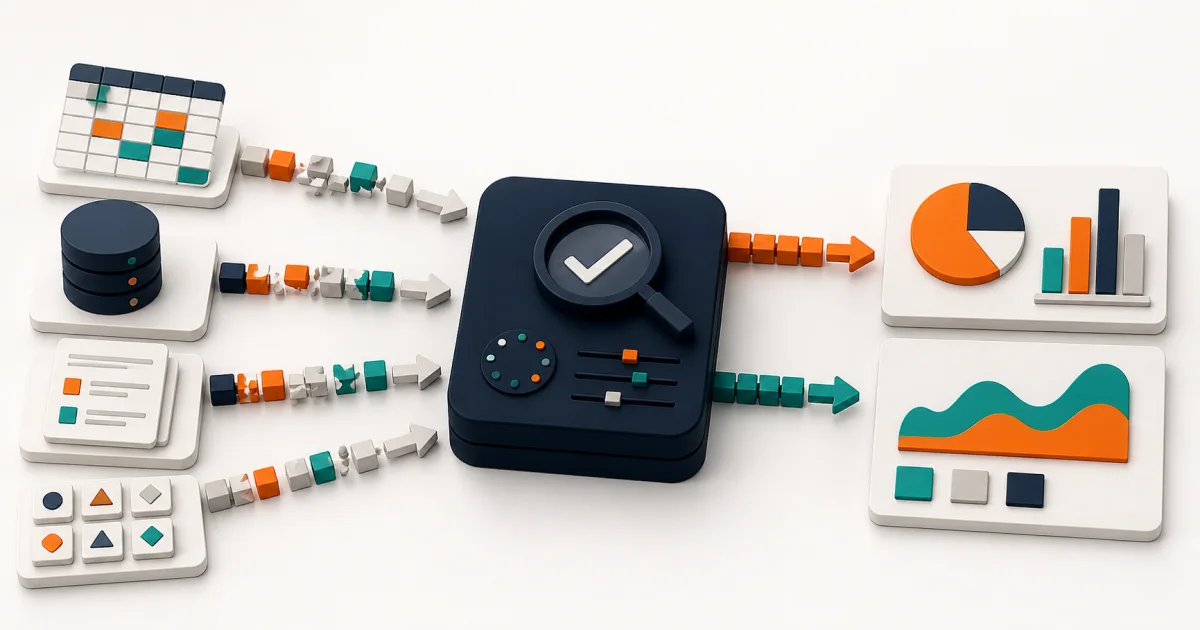
Your data is ready for a dashboard when the team can name the decision it supports, agree on each metric, identify an authoritative source, test quality for the intended use, match refresh timing to the decision, and assign an owner. You do not need perfect data. You need known limitations and a deliberate plan for what the first dashboard will—and will not—claim.
A dashboard interface cannot settle whether “active customer” means paid this month, logged in this month, or has an open contract. It cannot decide which spreadsheet is authoritative or repair a missing operational field. If those questions stay unresolved, polished charts make disagreement easier to see, not easier to solve.
| Readiness signal | Ready enough | Warning | First action |
|---|---|---|---|
| Decision | Named user, choice, and cadence | “See everything in one place” | Write the decisions first |
| Metrics | Formula and scope are agreed | Teams calculate the same KPI differently | Create metric contracts |
| Sources | System of record is named | Copied files compete with live systems | Map source to field |
| Operations | Owner, access, and refresh are known | One employee manually repairs every report | Document and test the pipeline |
Score one dashboard use case before estimating the build
Score a bounded use case, not the whole company. “A daily fulfillment dashboard for the operations lead to reassign late orders” is scoreable. “A single source of truth for everyone” is not. Give each factor zero, one, or two points.
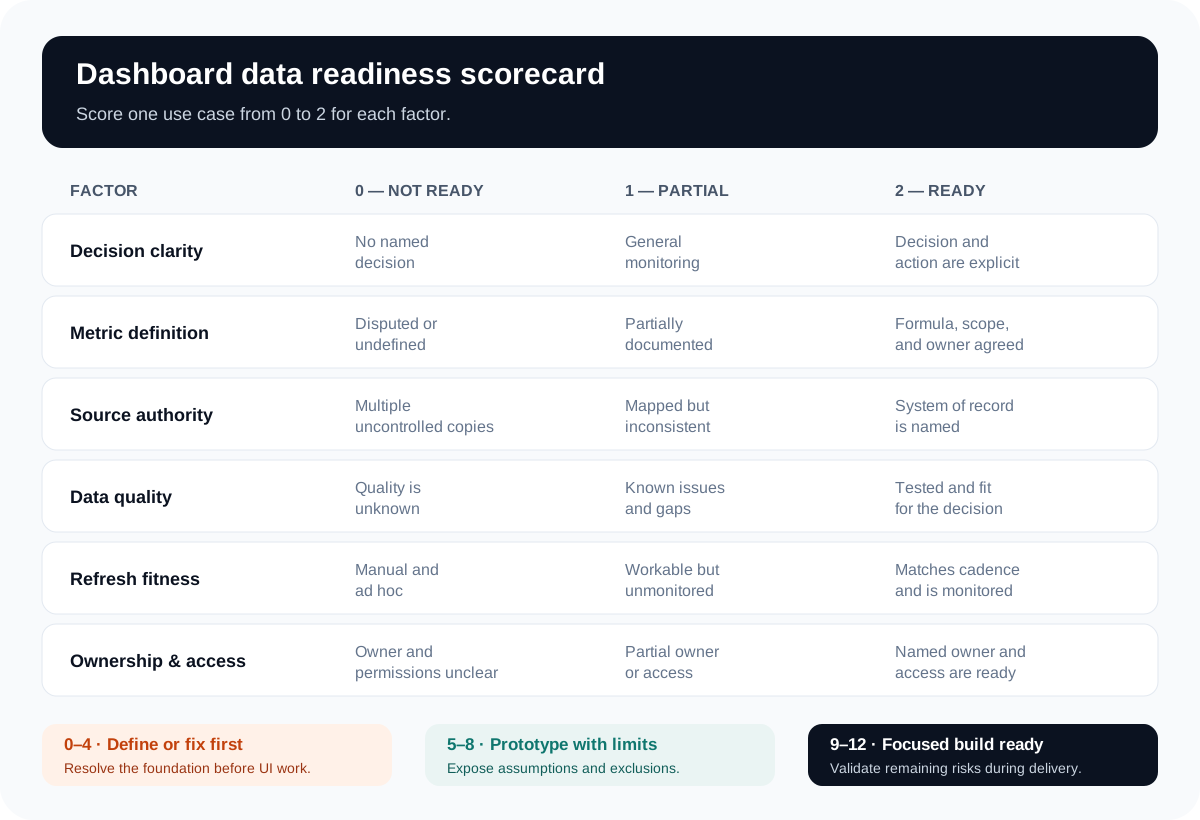
A score from zero to four means definition or foundation work should come first. Five to eight can support a limited prototype if assumptions and exclusions are visible. Nine to twelve is ready for a focused build, subject to security, feasibility, and the consequences of a wrong number. This is a Leeonex prioritization aid, not a universal benchmark.
1. Decision clarity
Name the user, the decision, how often it happens, and the action that follows. A useful dashboard changes what someone does: reprioritizes work, investigates a variance, reallocates capacity, or follows up with a customer. If no action follows, a scheduled report or alert may be simpler.
2. Metric definition
Ask two people to explain the metric independently. Compare formula, inclusion rules, exclusions, time window, segment, currency, status, and time zone. A familiar name can hide a materially different calculation.
3. Source authority
Name the system of record for every required field. A CRM may own account status while the billing platform owns recognized revenue. An exported spreadsheet can be an input, but the team must know who updates it, when, and whether edits are tracked. If the workbook runs the operating process rather than only supplying a report, use the spreadsheet replacement decision guide to assess the workflow separately.
4. Data quality
Test data against its intended decision. The UK Government Data Quality Framework describes quality as fitness for purpose and considers completeness, uniqueness, consistency, timeliness, validity, and accuracy. That framing matters: a field can be acceptable for a monthly directional review but unsafe for an individual customer action.
5. Refresh fitness
Define how fresh each decision actually needs to be, then test whether source access and processing can meet it reliably. “Real time” is not automatically better. It adds operational and cost constraints, while many management decisions remain useful with daily or hourly updates.
6. Ownership and access
A metric needs a business owner who can resolve meaning and a technical owner who can address pipeline failures. Confirm API, database, export, permission, retention, and test-environment access before treating the integration as a minor detail.
Turn every KPI into a metric contract
A metric contract is a short agreement between the people who use a number and the people who implement it. It prevents a designer from guessing at definitions and gives developers a testable target. Complete one for every version-one KPI.
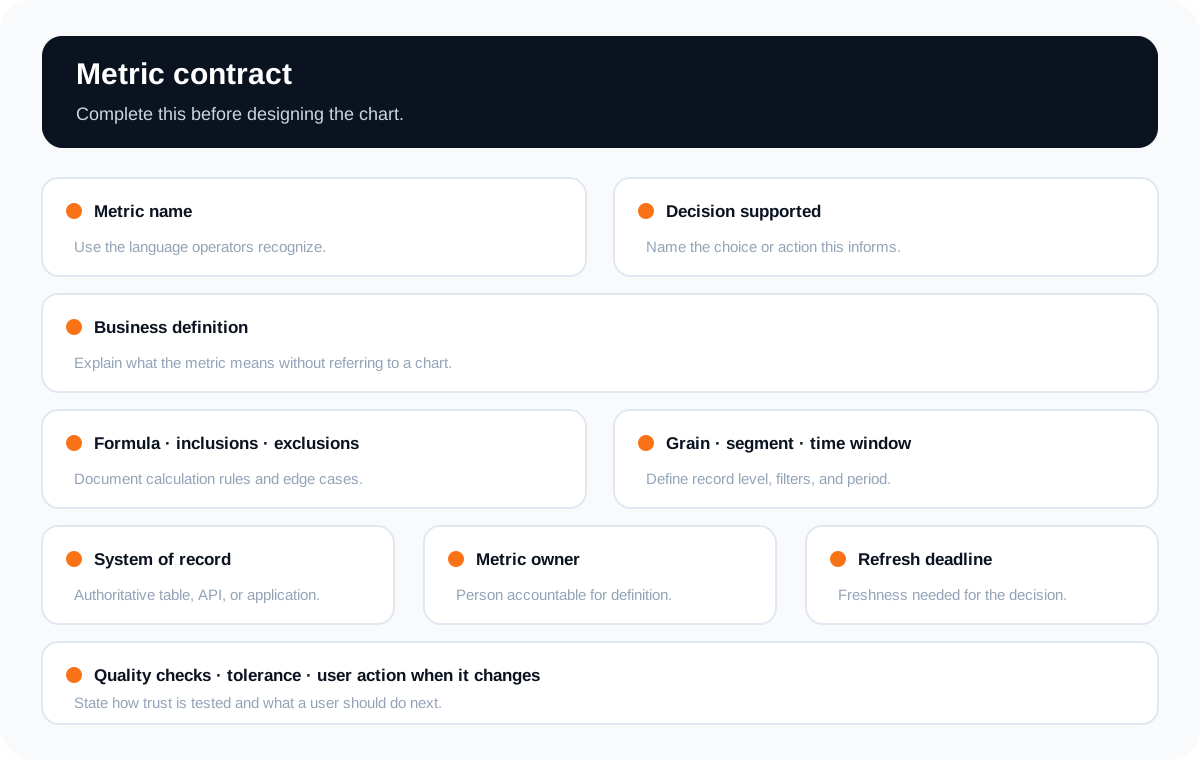
The contract should state the business definition in plain language, calculation rules, record grain, filters, time window, authoritative source, owner, refresh deadline, and quality checks. It should also describe what a user does when the number crosses a threshold. That final field connects the metric back to a real decision.
Version the agreement when the definition changes. If the old and new calculations are not comparable, show the break rather than silently rewriting history. The goal is not documentation for its own sake; it is a durable answer when someone asks, “Why does this number differ from last month’s report?”
Map the path from source record to business decision
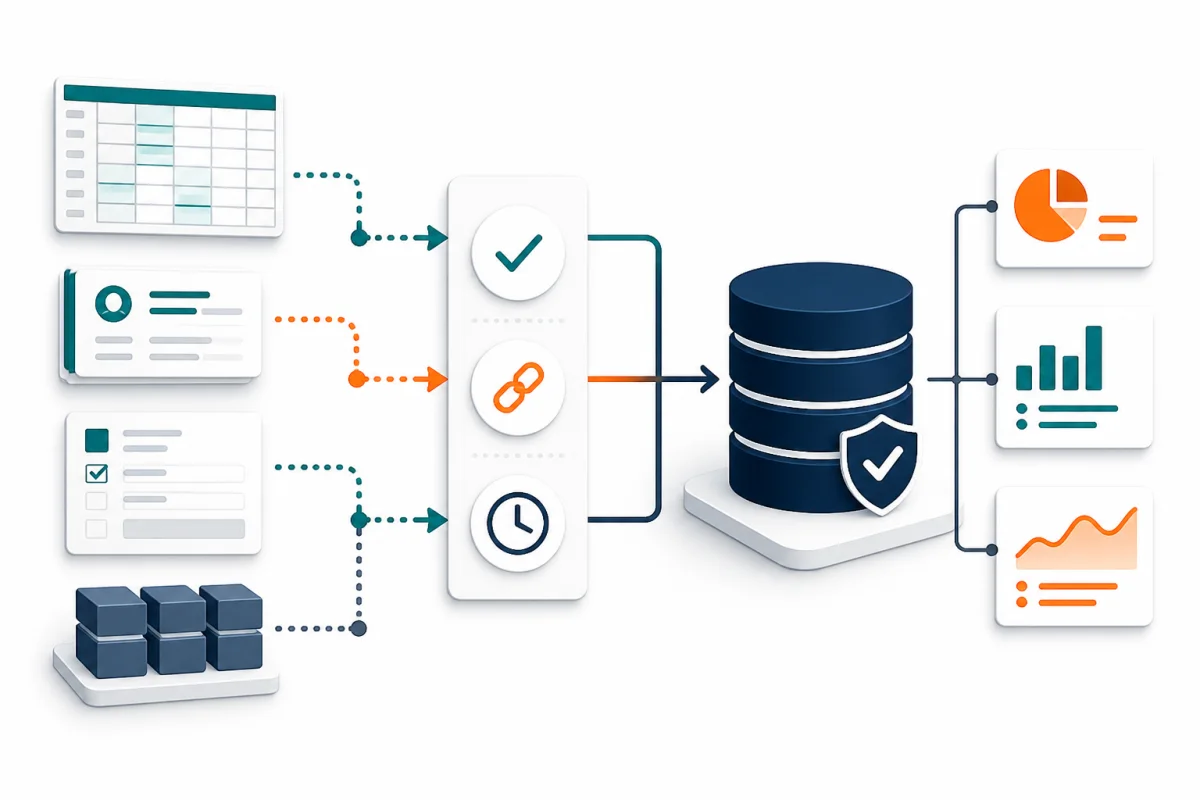
For each metric, trace the source application, tables or API fields, transformation, calculation, reporting model, chart, and user action. Include manual steps. A weekly spreadsheet correction is part of the system even if it does not appear in the architecture diagram.
Reconcile trusted examples before building charts
Select a few closed periods or completed operational cases. Calculate the proposed metric from the source and compare it with the report the business currently trusts. Investigate differences in status mapping, duplicates, joins, filters, timestamps, late-arriving records, and manual adjustments.
Do not force the new result to match merely because the old spreadsheet is familiar. The reconciliation may reveal that the spreadsheet is wrong, the source is incomplete, or both reports answer different questions. Record the decision and evidence.
Design refresh as an operated process
A refresh plan needs more than a frequency. Define the deadline, expected duration, failure alert, retry behavior, owner, and what users see when data is stale. Microsoft’s Power BI guidance similarly treats semantic-model preparation, connectivity, refresh operations, history, and monitoring as parts of the reporting system—not invisible setup details.
If several applications must feed the dashboard, reliable API integration may be the foundation work. If shared definitions and history are the main difficulty, a reporting model or warehouse may be more important than chart development.
When that shared analytical layer is the real project, use the data warehouse requirements checklist to define source contracts, grain, history, transformation, quality, lineage, access, service levels, and recovery before selecting a platform.
Choose the right next path—not always a dashboard
Build a focused dashboard
Use when decisions, metrics, sources, owners, and refresh expectations are clear enough to test with real users.
Define metrics first
Use when teams agree on the goal but calculate core KPIs differently. Resolve contracts before interface estimates.
Repair the data foundation
Use when source fields are missing, duplicate, inaccessible, or dependent on uncontrolled manual copies.
Keep a report or alert
Use when one recurring snapshot or threshold notification supports the decision better than an interactive interface.
Leeonex’s dashboard development services cover the reporting experience and the practical data work around it, including analytics dashboards and operations reporting. A useful discovery phase should be able to recommend a narrower report, integration work, or definition workshop when that is the more responsible investment.
If the data is ready but the delivery model is not, compare a BI workspace, a purpose-built interface, and an embedded hybrid with the BI tool versus custom dashboard guide.
Scope the first dashboard around one decision loop
Start with one audience, one operating cadence, a small set of related decisions, and only the metrics needed for those decisions. Define filters, drill-down depth, role access, export needs, supported devices, freshness display, empty states, and failure states before visual polish.
- Named users and the decisions they own.
- Metric contracts approved by business owners.
- Source-to-field map with access confirmed.
- Reconciliation examples and accepted limitations.
- Refresh schedule, stale-data behavior, and alert owner.
- Role permissions and sensitive-field handling.
- Acceptance tests using representative records.
- A review date for usage, trust, and next-scope decisions.
This is the same discipline used to choose the smallest useful product artifact. Our guide to a landing page, prototype, pilot, or MVP can help when the dashboard is part of a larger new product. If the data may later support AI automation, also run the AI workflow automation readiness checklist before letting generated outputs trigger operational actions.
To see those readiness decisions translated into a proposed product scope, review the exception-first operations dashboard concept study. It follows one decision loop from source validation to a prioritized queue, named owner, and recorded resolution without presenting the concept as a deployed result.
Finance operations teams can inspect a narrower application in the accounts receivable control dashboard concept study. It separates collectible, disputed, and uncertain balances into owned queues and makes reconciliation a release gate, without presenting illustrative finance records or collection outcomes as evidence.
SaaS product teams can also inspect the activation and retention dashboard concept study. It applies metric contracts, identity rules, cohort boundaries, and account-level reconciliation to the specific problem of competing product and billing numbers—without claiming a client implementation or retention result.
When the output is a recurring leadership review rather than a live operational dashboard, use the executive performance review visualization concept study. It carries governed metrics into an honest chart sequence, visible limitations, accessible alternatives, and a recorded decision without presenting an illustrative report as client evidence.
Avoid these common dashboard mistakes
- Starting with charts: chart choice follows the decision and metric, not the other way around.
- Combining every source immediately: each additional system adds identity, timing, quality, and ownership questions.
- Hiding stale data: show the last successful refresh and make failures visible.
- Using access as governance: permission to query a system does not determine which definition is correct.
- Treating launch as completion: monitor refresh health, adoption, disputed metrics, and decisions influenced.
Run this 60-minute dashboard readiness audit
- Write the decision: user, choice, cadence, and action.
- List version-one metrics: remove anything that does not support the decision.
- Test definitions: ask owners to calculate one metric independently.
- Map sources: record system, field, access method, owner, and manual edits.
- Check representative records: test completeness, validity, duplicates, consistency, timing, and accuracy.
- Reconcile one period: explain differences from the current trusted report.
- Score readiness: choose build, limited prototype, metric definition, or data repair.
The output should be a decision, not a long requirements document. If the foundation is ready, estimate a focused first version. If it is not, turn the specific gaps into a short data work plan with owners and acceptance checks.
Frequently asked questions
How clean must our data be before dashboard development?
It does not need to be perfect. It must be fit for the dashboard's intended decisions: known limitations, agreed definitions, testable quality rules, and an owner for exceptions. A focused first version can exclude unreliable fields instead of delaying every useful metric.
Do we need a data warehouse before building a dashboard?
Not always. A focused dashboard may work reliably from a small number of well-governed APIs or databases. A warehouse or other reporting layer becomes more useful when definitions must be shared across many sources, history must be preserved, or production systems cannot support reporting queries safely.
How many KPIs should the first dashboard include?
Include only the metrics required for the named users to make the named decisions. Start with a small, coherent decision set rather than filling a screen. Each KPI should have a definition, owner, source, refresh expectation, and intended action.
Does an operations dashboard need real-time data?
Only when the decision loses value if it waits. Match freshness to the operating cadence and the cost of delay. Daily or hourly refresh may be more reliable and economical than real time for many management decisions, while active dispatch or incident response may need faster updates.
What should we do when two reports show different numbers?
Pause visual development for that metric and reconcile the definitions, filters, time zones, source records, and update times. Name the authoritative source and document the result in the metric contract. A polished dashboard should not hide an unresolved disagreement.
Sources and further reading
- UK Government Data Quality Framework
- Microsoft: Power BI semantic models
- Microsoft: data-level auditing and refresh monitoring
The scorecard and metric-contract worksheet are Leeonex planning tools, not universal benchmarks or guarantees of data quality, feasibility, security, or business value.