Answer first
Define the measurement system before asking a dashboard to tell one clean story.
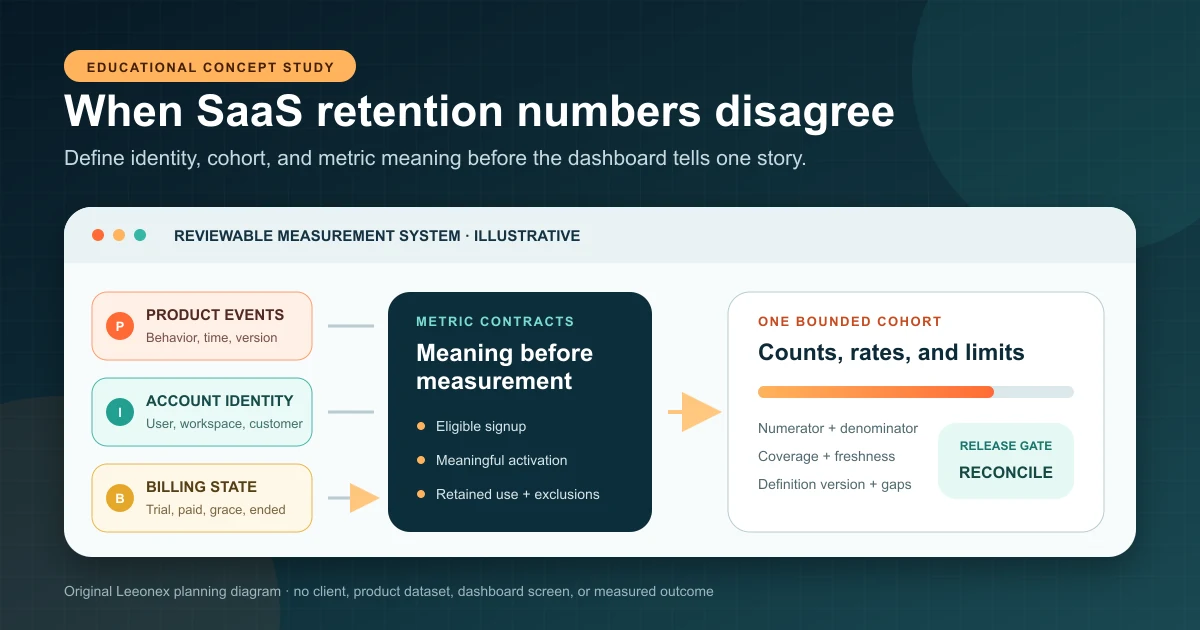
When SaaS activation and retention numbers disagree, start with definitions, identity, time, and source authority—not chart design. Write a versioned contract for who enters a cohort, what observable behavior counts as activation, which later behavior proves retained use, and what is excluded. Then map product users to accounts and commercial records without pretending uncertain joins are exact.
The smallest useful dashboard follows one bounded cohort from eligibility through activation to one retention interval. It shows numerator, denominator, freshness, coverage, definition version, and known gaps; reconciles representative accounts; and preserves a visible break when the meaning changes. That is enough to support a real product decision without claiming that the dashboard itself improves retention.
Evidence boundary
This is a Level E educational concept study. Leeonex has not implemented, tested, operated, or measured this analytics system for a client or production SaaS product. The dialogue, roles, metric contracts, cohort, account examples, diagrams, technology labels, counts, and decisions are illustrative planning material—not a product screen, customer record, testimonial, benchmark, or performance claim.
Starting situation and intended buyer
Everyone recognizes the KPI name, but each report answers a different question.
This concept is for a SaaS founder, product leader, growth team, or data owner who cannot confidently explain why activation, retention, or churn changes across tools. Product analytics may count active users, billing may count paying subscriptions, CRM may count customer accounts, and a board workbook may contain manual exclusions. Each number can be internally consistent while referring to a different population and time window.
The mismatch becomes expensive when teams use it to choose onboarding work, lifecycle campaigns, feature priorities, customer follow-up, or investment. More visual polish does not resolve whether a trial is eligible, whether an invited team member counts as activation, whether two workspaces belong to one customer, or whether a cancellation after the interval changes the cohort retrospectively.
The constraint is not “put all data in one place.” It is to create a reviewable agreement between product behavior, identity, account state, commercial state, and the decision the reader intends to make. A dashboard is the final interface to that agreement, not the agreement itself.
Illustrative discovery conversation — not a client quotation
A reporting dispute is often a definition and identity dispute.
Product leader
“Billing says we retained 82 accounts, product analytics says 97, and the board spreadsheet says 88. Can the dashboard settle the number?”
Leeonex
“What makes an account eligible, what action proves activation, which interval defines retained use, and how do trials, merges, cancellations, and late events behave?”
Product leader
“Those rules are different in each report. We also track users in the product but customers in billing.”
Leeonex
“Then the first deliverable is a versioned measurement contract and identity map. The dashboard should expose that model, not hide the disagreement behind one polished percentage.”
This exchange is Leeonex-authored teaching material. It describes no real customer, quotation, SaaS product, dataset, board report, implementation, or result.
User roles and decision ownership
Separate metric meaning, data implementation, commercial truth, and the decision that follows.
Product owner
Defines the user behavior that represents meaningful value, names the product decisions the dashboard should support, and accepts scope trade-offs.
Growth or lifecycle owner
Defines acquisition and cohort questions, documents campaign and experiment boundaries, and avoids treating correlation as causal proof.
Data or engineering owner
Owns instrumentation, identity resolution, transformations, tests, freshness, lineage, and the release path for metric-definition changes.
Commercial owner
Explains billing and contract states, reconciles customer-level examples, and keeps product activity distinct from paid retention and revenue measures.
One person may hold several roles in a small company, but the decisions remain distinct. Engineering should not invent the business meaning of activation, and a commercial definition of a customer should not silently replace the product question about meaningful use.
Core measurement flow
Follow one eligible account from entry to meaningful use and one later interval.
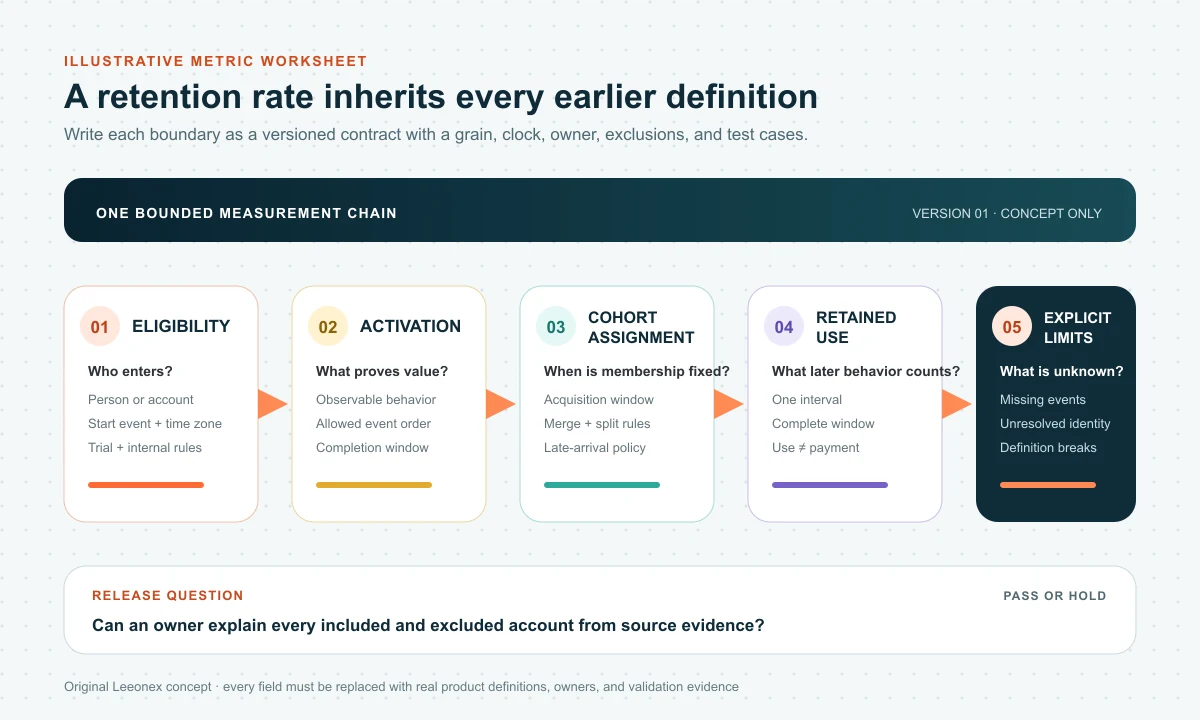
First, define cohort eligibility. State whether the grain is a person, workspace, account, subscription, or contract; the event or state that starts the clock; the time zone; and how trials, internal users, duplicates, test accounts, imports, and pre-existing customers behave. The denominator must be inspectable before a percentage is meaningful.
Second, define activation as evidence of value—not merely a convenient event. “Signed in” may prove access while “invited a teammate and completed the first shared workflow” may be closer to the product promise. The right action depends on the product and needs research or operational evidence; this concept does not declare a universal activation event.
Third, define retained use at one interval using behavior that remains relevant to the product job. Keep it separate from paid retention. A customer may pay without using the product or use it during grace, trial, or a disputed billing state. Both views can matter, but they should be named and modeled separately.
Finally, show the cohort as counts and rates with a path to the included records, permitted by access policy. Mark incomplete windows, late events, identity uncertainty, tracking gaps, and definition versions. The interface should help a reader ask a better question, not make the model appear more certain than it is.
Smallest useful scope
Build one defensible measurement chain now; earn broader product intelligence later.
Build now
- One metric contract each for eligible signup, meaningful activation, and retained use, including grain, window, time zone, filters, exclusions, owner, and version
- One identity path from anonymous visitor to user and account, with explicit rules for invitations, account merges, multiple workspaces, internal users, and deleted records
- One bounded acquisition cohort, activation event, retention interval, and useful segment—plus numerator, denominator, and incomplete-data labels
- A reconciliation set of representative accounts covering the happy path, trial, cancellation, reactivation, duplicate identity, late event, and missing-event cases
- A release workflow that tests source freshness and model changes, shows definition versions, preserves comparison breaks, and assigns discrepancy ownership
Validate later or exclude
- Predictive churn scores, AI-generated recommendations, customer health scoring, or automatic outreach before descriptive measures are trustworthy and governed
- Multi-touch attribution, incrementality, or experiment causality inferred from ordinary dashboard filters
- Every historical event, persona, pricing plan, lifecycle stage, region, campaign, device, and feature in the first dashboard
- A real-time streaming pipeline when daily or scheduled refresh meets the actual decision cadence
- Silent backfills or formula changes that make the current chart look continuous while changing what earlier periods meant
Architecture and implementation decisions
Preserve raw evidence, model identity explicitly, and version the semantic layer.
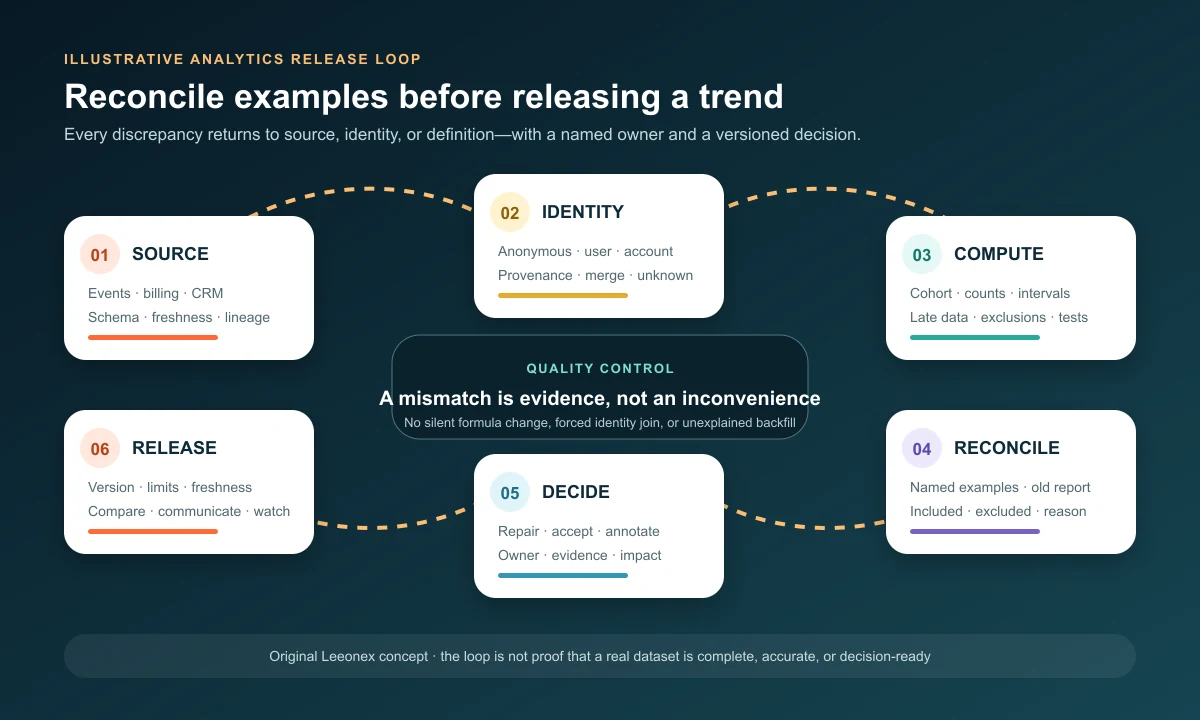
Instrument product events around stable business actions with a documented schema, event identifier, source timestamp, received timestamp, actor, account context, product version, and only the attributes needed for approved questions. Validate events at collection and monitor volume, missing fields, duplicates, and unexpected schema changes. Event names alone are not a data contract.
Build identity as a model with provenance. An anonymous device, authenticated user, workspace membership, customer account, and billing subscription are different entities. Store how and when links were asserted, what happens after merges or splits, and which historic interpretations may change. Do not force a join merely to eliminate an “unknown” category.
Transform source events and commercial states into a tested analytics model before the presentation layer. Keep cohort assignment stable, define late-arrival and backfill policy, and compute counts before rates. The dashboard should read from versioned semantic outputs rather than duplicate formula logic inside several charts.
Reconcile named examples from source to output. For each one, show why it entered or missed the denominator, which event satisfied activation, which identity link was used, whether the retention window is complete, and how billing state is treated. A few examples do not statistically validate the whole model, but they expose category mistakes before aggregate trends make them harder to find.
Risks and guardrails
Product analytics can create false confidence, privacy exposure, and retrospective stories if controls stay invisible.
Collect only events and identity attributes needed for the approved product questions; document consent, purpose, access, retention, deletion, residency, and sensitive-data handling for the real jurisdictions and product.
Keep raw events immutable where appropriate, version transformations and metric contracts, test schema changes, and record when a definition makes old and new periods non-comparable.
Separate user activity, account activity, subscription state, paid retention, and revenue. Similar labels must not collapse different grains or commercial meanings.
Show freshness, coverage, sample boundaries, excluded records, late-event policy, and known instrumentation gaps near the affected view—not only in a distant data dictionary.
Restrict drill-down and exports by role, protect personal and commercial data, log sensitive access where required, and test aggregate views against re-identification risk.
Treat a metric change like a product release: named owner, review evidence, representative reconciliation, downstream impact check, communication, and rollback or version path.
Limitations and evidence needed
This blueprint cannot identify the right activation event or prove that a real retention model is correct.
Leeonex did not inspect user research, a product journey, event stream, tracking implementation, account model, billing provider, CRM, warehouse, spreadsheet, dashboard, privacy policy, or team decision process for this study. The appropriate grain, window, activation behavior, segmentation, architecture, refresh cadence, access model, and release controls depend on the real product and its obligations.
Stronger delivery evidence would require an approved scope, responsibility record, source inventory, event and identity contracts, transformation tests, reconciliation results, definition-version history, dashboard acceptance evidence, and permission to describe the work. Any outcome statement would also need a defined baseline and end state, cohort and segment boundaries, observation window, calculation, exclusions, source system, verifier, attribution limits, and approved public wording. A dashboard release alone cannot prove improved activation, retention, revenue, trust, or decision quality.
Lessons and related decisions
A useful retention dashboard is a governed product model, not a collection of familiar charts.
The first success condition is explainability: a responsible owner can name the population, action, interval, identity path, formula, version, freshness, exclusions, and known uncertainty; then trace a disputed example back to source evidence. Only after that should the team expand segments, intervals, or lifecycle views.
Start with the Leeonex dashboard data-readiness checklist to test decision clarity, metric ownership, source authority, quality, refresh, and access. Then compare delivery paths in the BI tool versus custom dashboard guide. If product activity and subscription access are coupled, the SaaS billing and entitlements concept separates payment events from product permission.
Browse the Leeonex case-study hub for other clearly labeled educational concepts and owned-work studies. Each page keeps proposed scope, implementation facts, and performance claims separate.
What to bring to a first consultation
Bring one disputed cohort and the evidence behind each competing answer.
- The product decisions the dashboard should support, their cadence, the people who act, and examples of actions taken when activation or retention changes
- Current formulas, spreadsheets, analytics queries, screenshots, board definitions, billing reports, disagreements, and the report each team currently trusts
- Event taxonomy, tracking plan, sample payloads, account and user identifiers, anonymous-to-known rules, workspace membership, merges, deletions, and late-event behavior
- Trial, plan, subscription, cancellation, pause, grace, reactivation, refund, and contract rules—with the authoritative source for each commercial state
- One representative cohort and a small set of named accounts that cover ordinary, missing, duplicate, changed, and disputed histories
- Privacy, consent, retention, access, export, residency, compliance, refresh, latency, tooling, budget, and team-ownership constraints
Leeonex's analytics dashboard development service covers KPI design, filters and drill-downs, product or business data, role-aware views, exports, and maintainable frontend and backend work. The responsible first step may be a metric workshop or instrumentation repair before interface development begins.
Discuss a product analytics plan