
The short answer: choose by exploration, action, and ownership
Choose a BI tool when analysts and business users need to explore governed data, create reports, and change questions without engineering every view. Choose a custom dashboard when a narrow audience needs a tailored, product-quality interface that turns data into a repeatable action. Choose embedded analytics when the application should own identity and workflow while a BI platform supplies some modeling, exploration, or visualization capabilities.
Do not decide from chart appearance. All three paths can display a bar chart. The important differences are who defines metrics, who can create new questions, how permissions map to users and tenants, how deeply the interface participates in the workflow, and who supports every layer after launch.
BI tool
Best when exploration and report creation are the product users need.
Custom
Best when a focused decision and action need a tailored application surface.
Embedded
Best when vendor analytics and custom product workflow have a clear seam.
Compare BI, custom, and embedded as operating models
A BI tool packages capabilities such as semantic modeling, report authoring, filtering, drill-down, sharing, exports, governance, and administration. A custom application packages only what the product requires, but the product team must design and maintain it. Embedded analytics uses a vendor inside a custom experience; it reduces some work without removing the integration and ownership questions.
| Decision | BI tool | Custom dashboard | Embedded hybrid |
|---|---|---|---|
| Primary value | Explore and author analysis | Complete a focused decision | Explore inside a product workflow |
| Interface | Platform interaction model | Purpose-built product UX | Custom shell plus vendor components |
| New questions | Often created by approved users | Usually requires product change | Depends on exposed vendor capability |
| Actions | Analysis, sharing, alerting, export | Native approvals, updates, and workflows | Analytics linked to custom actions |
| Ownership | Vendor platform plus internal data owners | Product, data, and engineering team | Shared across vendor and product layers |
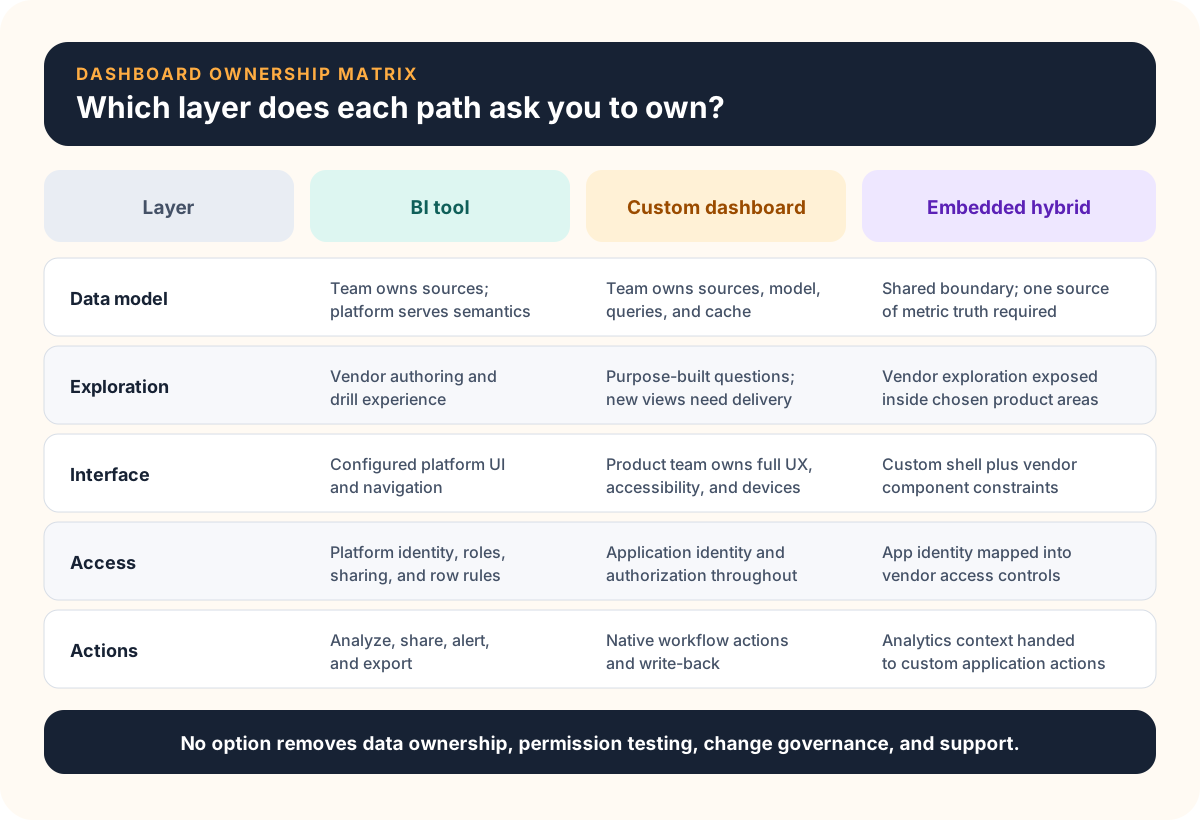
Embedded analytics is a real third option, not a cosmetic iframe afterthought. Microsoft documents separate Power BI embedding modes for organizational users and external customers, with different authentication and licensing responsibilities. Google documents Looker embedding through signed URLs, iframes, and an SDK. Review the current Power BI embedded analytics overview and Looker embed overview as examples of how much architecture sits behind “embed the dashboard.”
Run the dashboard delivery decision test
1. Who is the user, and are they exploring?
Analysts who form new questions need flexible dimensions, measures, filters, drill paths, and authoring. A warehouse supervisor checking late orders needs a stable queue with clear thresholds and next actions. Do not force the supervisor into a general analysis tool or constrain an analyst to six fixed cards.
2. Is the dashboard a destination or part of a workflow?
A monthly performance review can happen inside a BI workspace. An operations view may need to assign an owner, change a status, acknowledge an alert, open the source record, or record a decision. The deeper reporting and action must share context, the stronger the case for a custom interface or a deliberate embedded design.
3. How much product UX matters?
Internal analysts may accept a platform’s navigation and visual language. Customers paying for analytics inside a SaaS product may expect the same identity, responsiveness, accessibility, terminology, support, and interaction quality as the rest of the application. List the exact experience requirements instead of saying “fully branded.”
4. Who can define and change metrics?
Self-service is valuable only with governance. Name metric owners, source owners, permitted creators, certified views, and the process for changing a definition. If every new question requires code, a custom dashboard can become a reporting queue. If every user can publish a measure, a BI estate can produce conflicting answers at scale.
5. What must your team own?
A custom build owns interface design, chart behavior, accessibility, responsiveness, caching, exports, testing, observability, releases, and support. A BI implementation still owns source pipelines, semantic models, access, report governance, capacity, vendor administration, and user support. A hybrid owns both plus the contract between them.
Keep the data and permission boundary visible
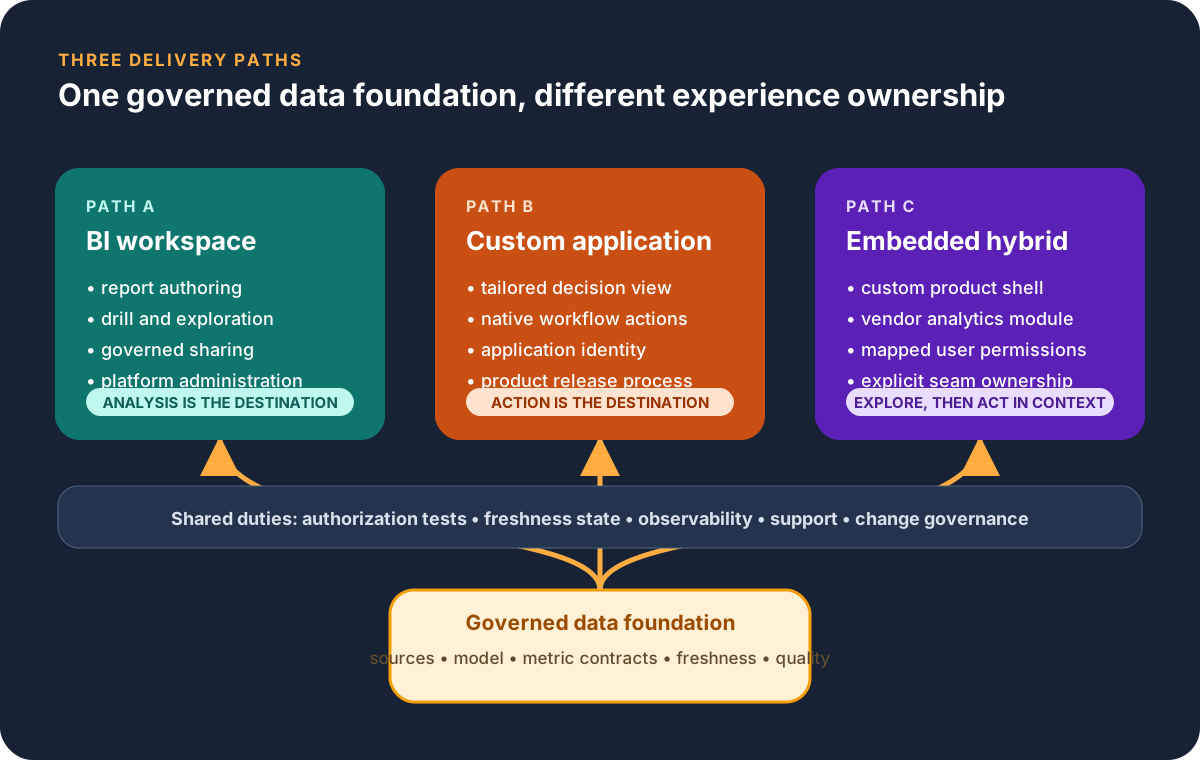
Dashboard technology cannot repair ambiguous metrics or unowned source data. Define the record grain, dimensions, calculations, filters, time rules, refresh target, quality checks, and owner before choosing the presentation layer. Microsoft’s Power BI star-schema guidance is one vendor-specific example of why model structure remains important for performance and usability.
Test tenant and role isolation with real cases
“Role-based access” is not one checkbox. Test a permitted row, a forbidden row, a restricted field, an export, a shared link, a cached response, a user changing organizations, and an administrator path. In customer-facing analytics, decide whether tenants share a model with enforced filters or use isolated models and workspaces. The correct boundary depends on risk, scale, operations, and platform behavior.
Microsoft’s Power BI Embedded security documentation describes row-level, object-level, and workspace-isolation approaches. Metabase likewise distinguishes authenticated, guest, modular, and full-app embedding in its official embedding overview. These capabilities are useful, but the implementing application still has to map its users and policies correctly.
Design the failure experience
Decide what users see when data is late, a source is partial, a query times out, an embed token fails, or the vendor is unavailable. Show freshness and known limitations where they affect a decision. Give operators a trace from a displayed number back to its model and source. Trust comes from visible definitions and recovery, not visual polish alone.
If source reliability and metric agreement are not yet settled, complete the dashboard data-readiness checklist before choosing the interface path.
Compare total ownership with explicit scenarios
For BI or embedded analytics, model the current licensing and capacity rules for creators, internal viewers, external users, environments, refresh, support, and required feature tiers. Confirm them in vendor documentation because plans change. Add implementation, modeling, administration, training, report governance, integration, and vendor migration work.
For custom development, include discovery, UX, data modeling, application engineering, identity, permissions, testing, hosting, monitoring, support, accessibility, exports, and future report changes. Reusing chart and data libraries reduces work; it does not transfer product ownership to a vendor.
Compare three or four concrete cases instead of inventing a universal break-even point: the first trusted board, one new metric and dimension, one additional tenant or role, a source outage, and a customer-requested workflow action. State user counts, data volume, refresh, change frequency, and support assumptions beside the result.
Leeonex’s dashboard development service starts from decisions and data ownership, while analytics dashboard development is relevant for filterable KPI and product views. When reporting is one surface inside a larger operational product, web application development may be the more accurate scope.
For a focused finance example, the educational cash-runway scenario dashboard concept study shows why a tailored decision view still needs reconciled source cash, versioned assumptions, bounded scenarios, and preserved review snapshots. It is a planning blueprint, not a company forecast, client result, or financial recommendation.
Complete the dashboard decision brief
Write one brief before product demonstrations. Name the audience, recurring decisions, exploration needs, in-context actions, metric contracts, sources and freshness, identity and tenant model, export rules, accessibility needs, owners, change frequency, support expectations, cost assumptions, and acceptance cases.
If the experience will live inside a customer-facing SaaS product, continue with the embedded analytics requirements checklist to define tenant isolation, product context, delivery behavior, exports, and release evidence before selecting an embed model.
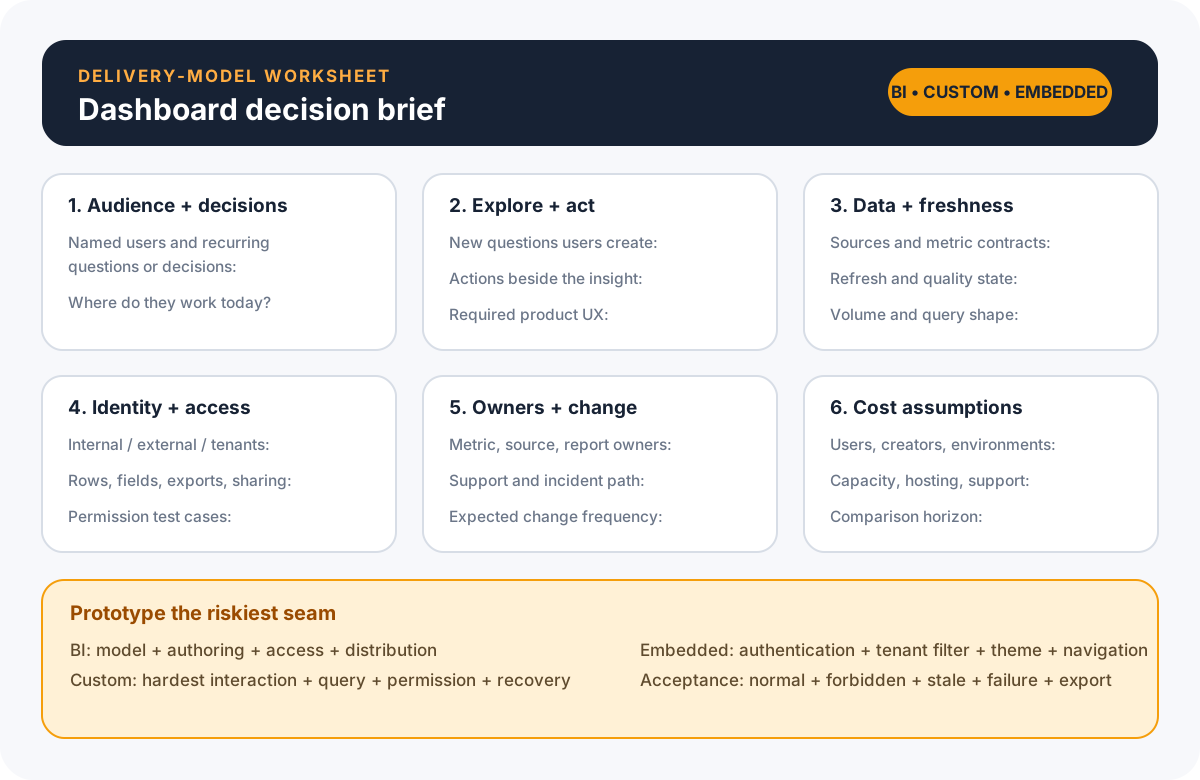
Then prototype the riskiest seam with representative data. For BI, test the model, authoring, permissions, and distribution path. For custom, test the hardest interaction, query, and access rule. For embedded analytics, test authentication, tenant filtering, theming, navigation, performance, and the handoff from insight to product action. Choose from observed fit, not the most polished demo.
Frequently asked questions
When should a business use a BI tool?
Use a BI tool when analysts or business users need to explore governed data, create and change reports, drill into questions, and distribute internal analysis without engineering every view. It is especially useful when the organization accepts the tool's interaction model and has people who can own data modeling, permissions, and report governance.
When is a custom dashboard worth building?
A custom dashboard is more defensible when the interface serves a narrow recurring decision, must fit a product or operational workflow, needs tailored actions and write-back, has unusual permission or tenant rules, or is part of the customer experience. The organization must also be willing to own design, engineering, testing, observability, accessibility, and support.
Can you embed a BI tool inside a custom application?
Yes. Embedded analytics can place vendor reports, dashboards, visualizations, or exploration components inside an application. The application and BI platform still need an explicit contract for authentication, authorization, tenant isolation, data models, theming, navigation, exports, performance, licensing, and incident ownership.
Is a custom dashboard cheaper than Power BI or another BI tool?
There is no universal answer. Compare the specific licensing and capacity model against discovery, implementation, hosting, data work, security, maintenance, support, and the opportunity cost of engineering. Model expected users, viewers, creators, refresh, data volume, change frequency, and workflow needs instead of using a generic price claim.
What should be decided before choosing dashboard technology?
Define the audience, decisions, questions, required exploration, in-context actions, metric contracts, sources, freshness, access model, tenant boundaries, exports, accessibility needs, owners, support expectations, acceptance cases, and budget horizon. Technology selection becomes much clearer once those responsibilities are visible.